Introduction
The economy is often cited as a core ‘fundamental’ in predicting election outcomes. A strong economy typically suggests that the incumbent party is likely to win and vice versa. In some elections, like in 1980, where rampant inflation—significantly rising gas prices—dominated, it was clear that incumbent Jimmy Carter would lose due to the weak economy. However, in other elections, such as 2012 or 2016, it was less clear whether the economy was strong enough to predict an incumbent party victory.
Voters’ interactions with the economy can influence their votes in various ways. Some may be ‘pocketbook voters,’ supporting incumbents when they are personally better off. Others may focus on macroeconomic issues, such as GDP growth or unemployment rates, that may not directly affect them but could still influence their vote through sociotropic considerations.
It is also unclear which economic timeframe is most important in shaping voters’ decisions. Does the economy’s performance right before the election matter most? Or does the entire term or just the year leading up to the election have a greater impact on vote share?
To explore some of these questions, I created six models that examine economic factors relative to incumbent two-party vote share. The first two models measure the percent change in real disposable personal income (RDPI), one of the most common metrics for predicting elections. The first model looks at the increase from the end of Quarter 1 to the end of Quarter 2 in an election year. Typically, data from Quarter 2 to Quarter 3 would be preferred. Still, because I aim to use this data to predict the 2024 election outcome, I am using Quarter 2 as the latest available data to match current 2024 figures. The second RDPI model looks at percent growth over the course of a year, from the end of Q2 one year before the election to the end of Q2 in the election year. For example, the first point in the dataset measures growth from Q2 1959 to Q2 1960.
In addition to RDPI, I developed two models each for quarterly and annual percent growth in unemployment and the S&P 500. These factors offer a scale of how much voters care about personal wealth versus macroeconomic health. RDPI is theoretically the most personally relevant, the S&P 500 falls somewhere in between, and unemployment most represents sociotropic concerns.
Before diving into the models, I want to clarify that I used the same years for each dataset, starting from 1960—the first election with complete data. I also excluded 2020 from all models due to the massive Q2 economic decline caused by the COVID-19 pandemic, which is an anomaly that wouldn’t be expected in a non-pandemic election year. While these limitations certainly affect the results, I believe they provide the most representative picture of an average presidential election.
Real Disposable Personal Income Growth
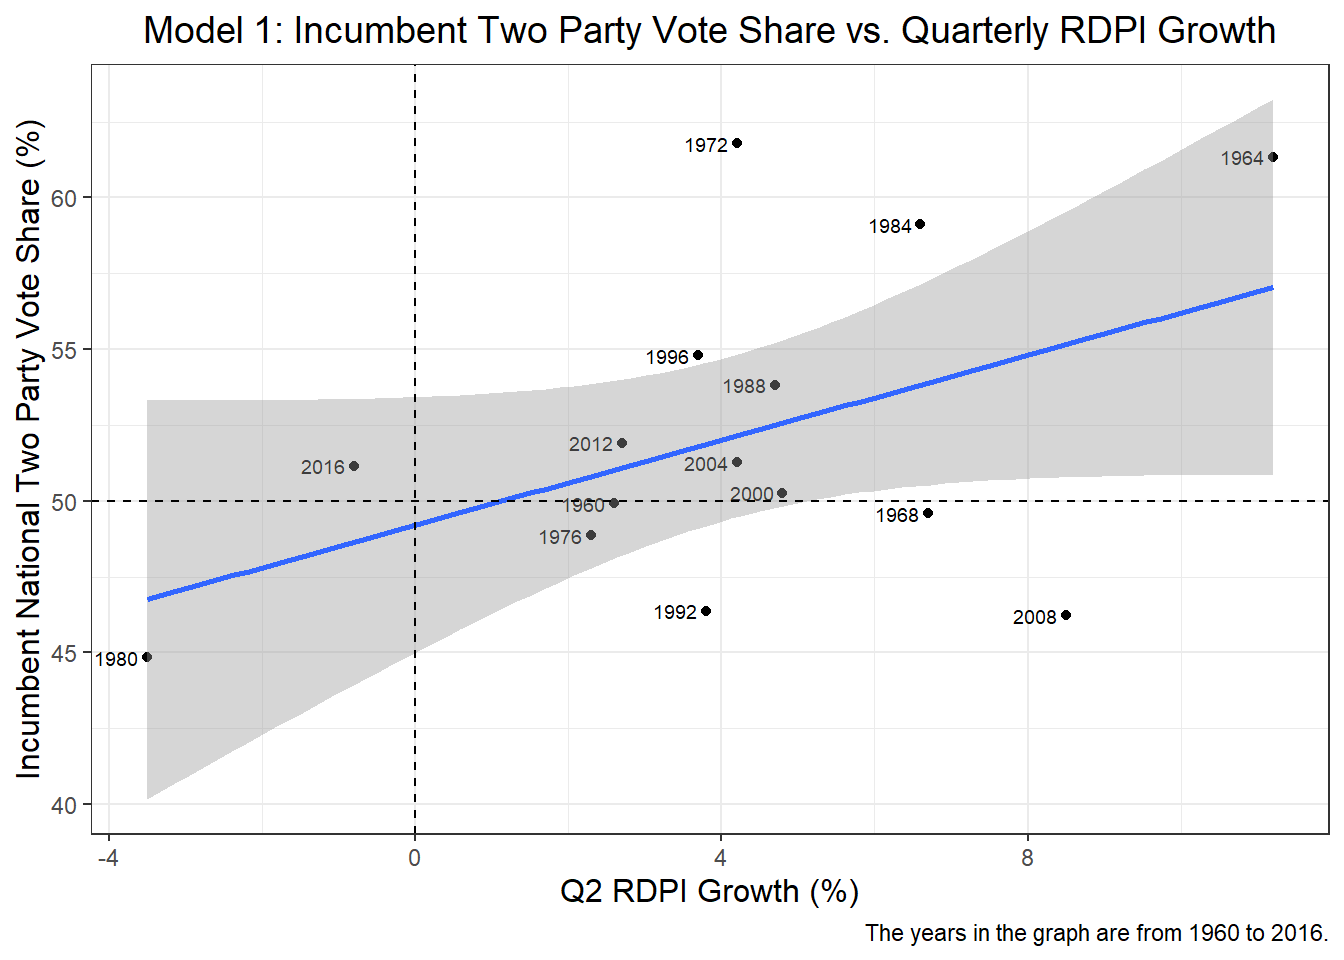
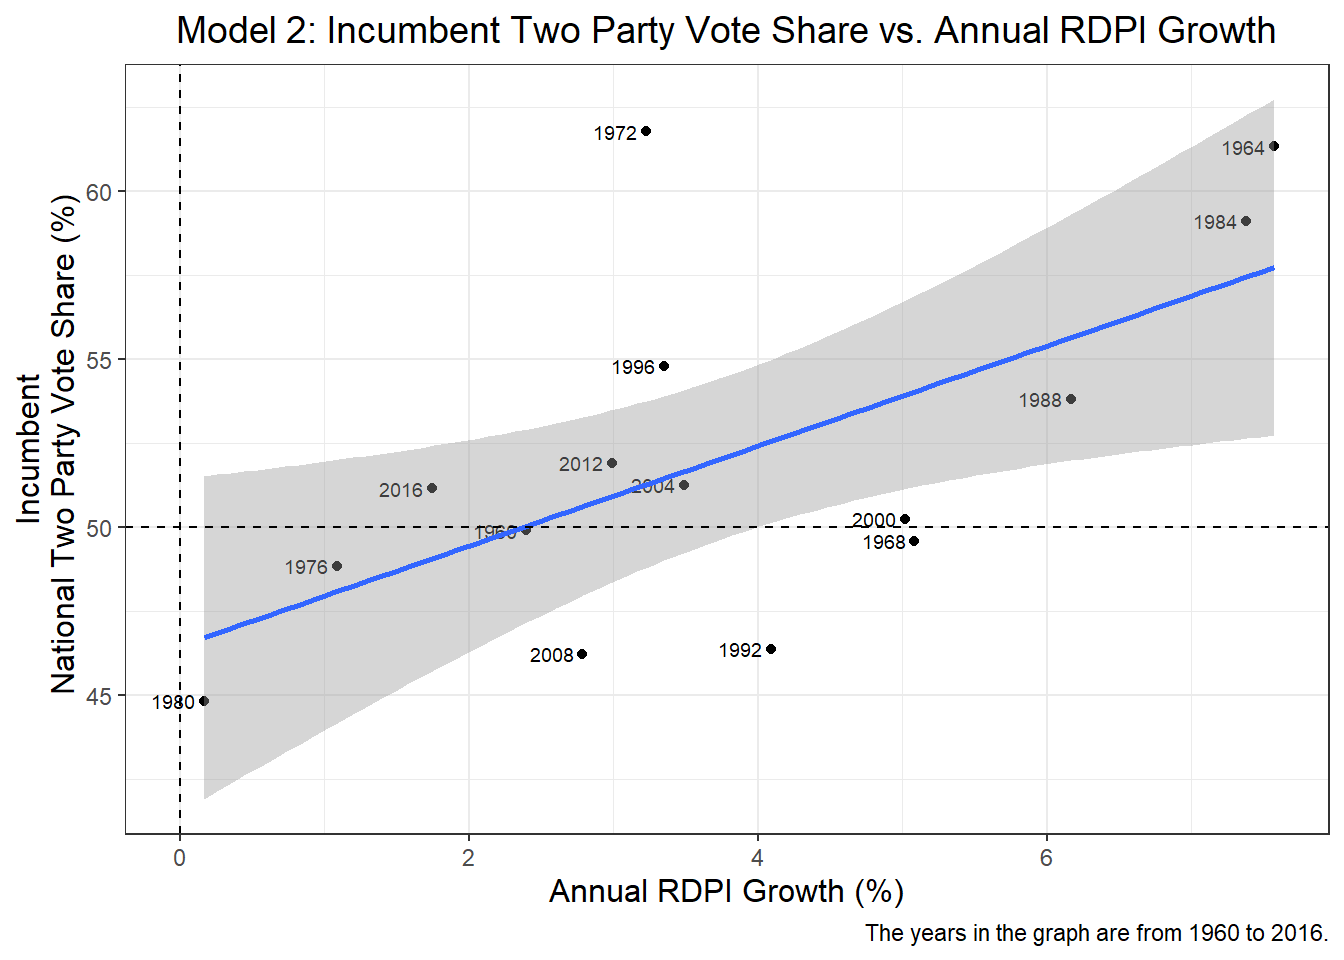
Both the annual and quarterly RDPI growth models show a similar trend, with a slightly positive slope, indicating a direct relationship between RDPI growth and election outcomes. A cursory glance suggests that the annual model has a larger coefficient, which is confirmed by the data below (1.49 vs. 0.7). Interestingly, the annual model also has a significantly lower p-value and a higher R-squared value (0.374 vs. 0.22 for the quarterly model). These figures suggest that the annual model is a better predictor than the quarterly model, as it explains more of the variance in the election outcome. However, with an R-squared of 0.374, it is clear that neither model accounts for enough of the election dynamics to serve as a strong standalone predictor.
| Incumbent National Popular Two Party Vote Share (%) | ||||
|---|---|---|---|---|
| Predictors | Estimates | std. Error | CI | p |
| (Intercept) | 49.21 | 1.95 | 45.00 – 53.42 | <0.001 |
| Quarterly RDPI Growth (%) | 0.70 | 0.37 | -0.09 – 1.49 | 0.078 |
| Observations | 15 | |||
| R2 / R2 adjusted | 0.220 / 0.160 | |||
| Incumbent National Popular Two Party Vote Share (%) | ||||
|---|---|---|---|---|
| Predictors | Estimates | std. Error | CI | p |
| (Intercept) | 46.48 | 2.30 | 41.50 – 51.45 | <0.001 |
| Annual RDPI Growth (%) | 1.49 | 0.53 | 0.33 – 2.64 | 0.015 |
| Observations | 15 | |||
| R2 / R2 adjusted | 0.374 / 0.325 | |||
S&P 500 Growth
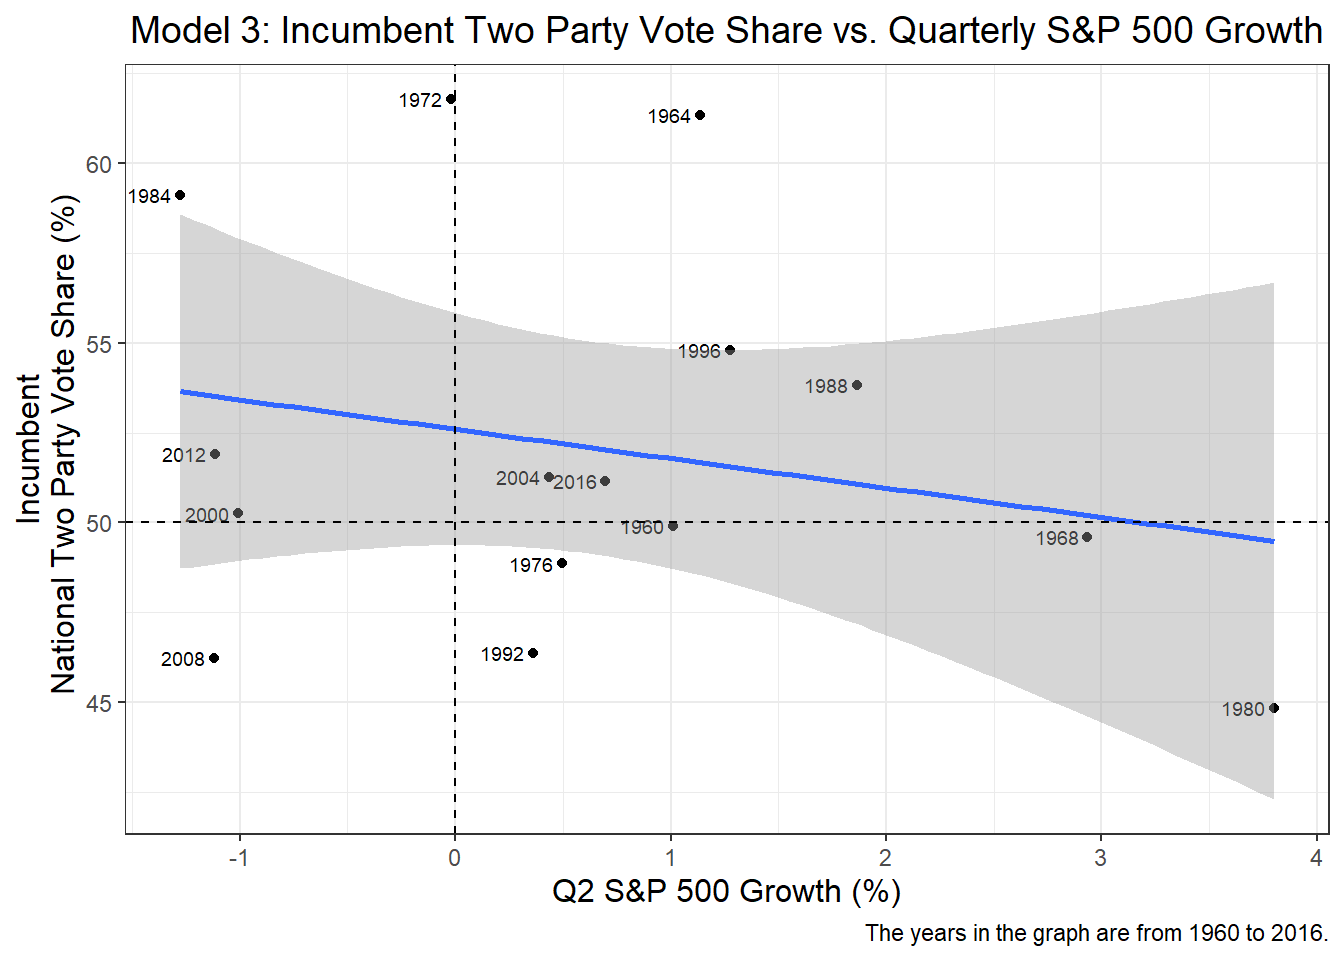
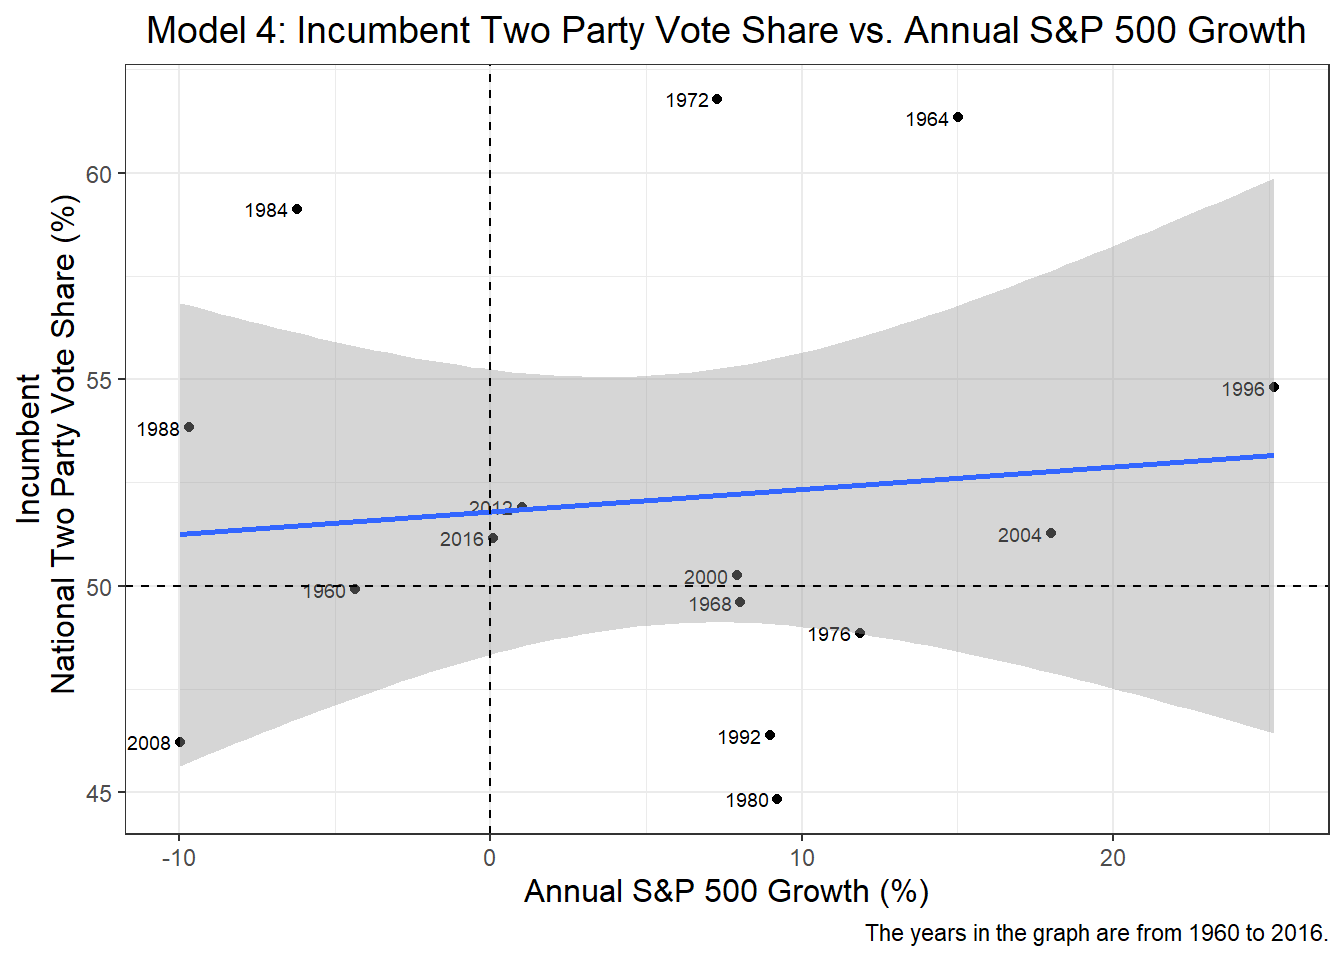
These graphs were quite unexpected for me. I initially thought the S&P 500 would be a strong indicator of how most Americans perceive the economy, given that it is reported daily by nearly every news source and many Americans have a significant personal stake in its performance, especially through retirement savings tied to the S&P 500. However, the nearly flat lines in both graphs and the large standard errors indicate that the S&P 500 is a poor predictor of election outcomes.
Looking at the tables, the quarterly growth shows a slight inverse relationship of -0.82, which doesn’t make much sense, though this result can largely be disregarded due to the high p-value and the low R-squared of 0.053. The annual model shows almost no relationship between two-party vote share and annual S&P 500 growth, with similarly large p-values and inconsequential R-squared values.
Overall, while the S&P 500 may have value in models that aggregate multiple economic variables, it is clear that it performs poorly as a standalone predictor of election outcomes.
| Incumbent National Popular Two Party Vote Share (%) | ||||
|---|---|---|---|---|
| Predictors | Estimates | std. Error | CI | p |
| (Intercept) | 52.60 | 1.50 | 49.37 – 55.84 | <0.001 |
| Quarterly S&P 500 Growth (%) | -0.82 | 0.96 | -2.88 – 1.25 | 0.408 |
| Observations | 15 | |||
| R2 / R2 adjusted | 0.053 / -0.020 | |||
| Incumbent National Popular Two Party Vote Share (%) | ||||
|---|---|---|---|---|
| Predictors | Estimates | std. Error | CI | p |
| (Intercept) | 51.79 | 1.60 | 48.34 – 55.24 | <0.001 |
| Annual S&P 500 Growth (%) | 0.05 | 0.14 | -0.25 – 0.36 | 0.707 |
| Observations | 15 | |||
| R2 / R2 adjusted | 0.011 / -0.065 | |||
Unemployment Growth
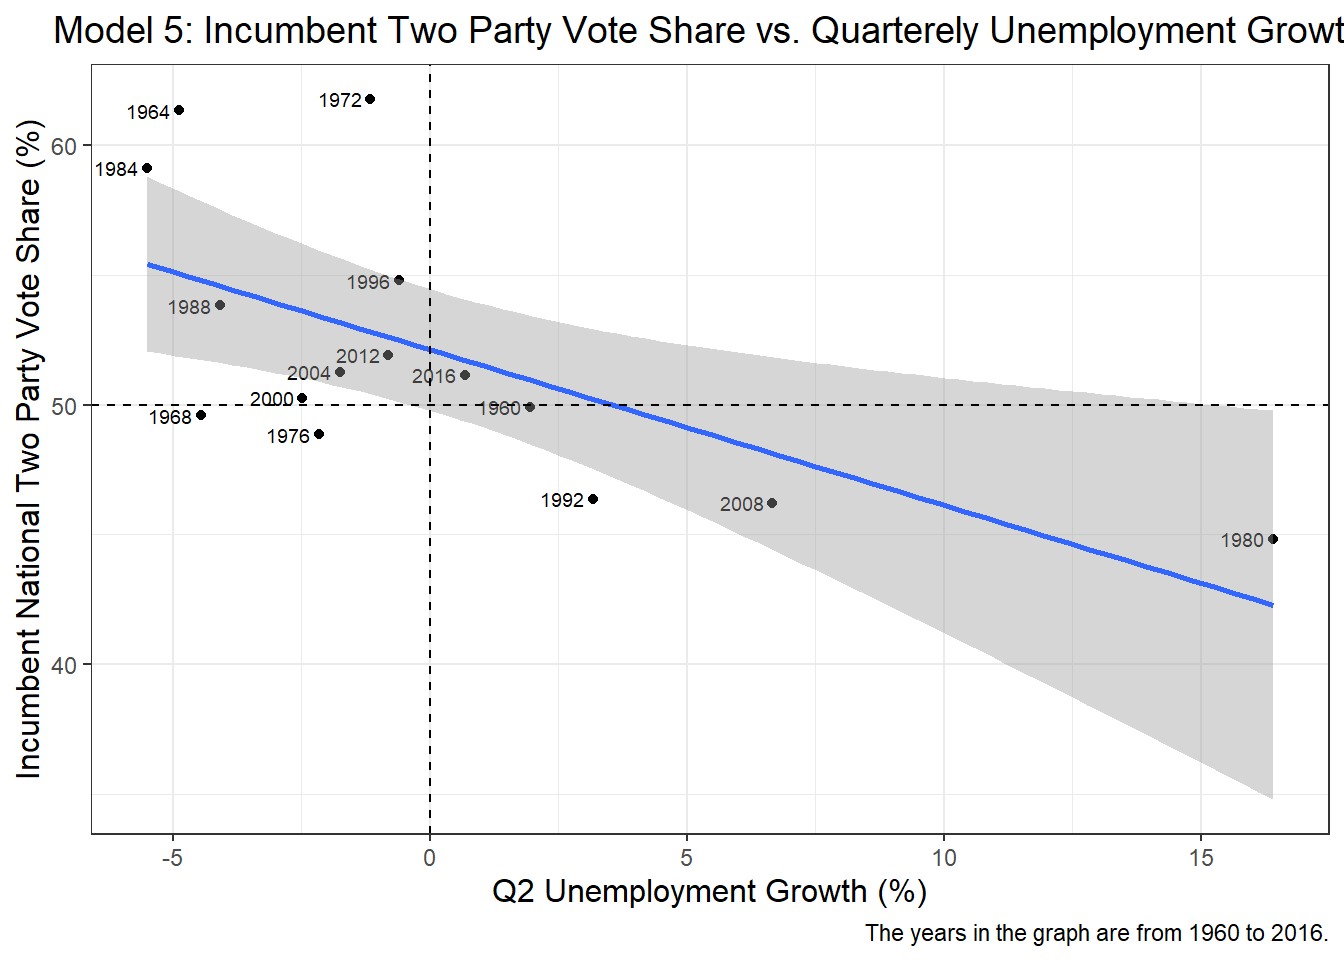
Unemployment growth also proved surprising, though for the opposite reason. I chose to focus on unemployment rather than GDP as a test of macroeconomic conditions, since unemployment is typically more frequently reported in the news than GDP, as evidenced by its relevance in Tuesday’s debate. Many Americans who vote based on sociotropic conditions may be more influenced by unemployment than GDP.
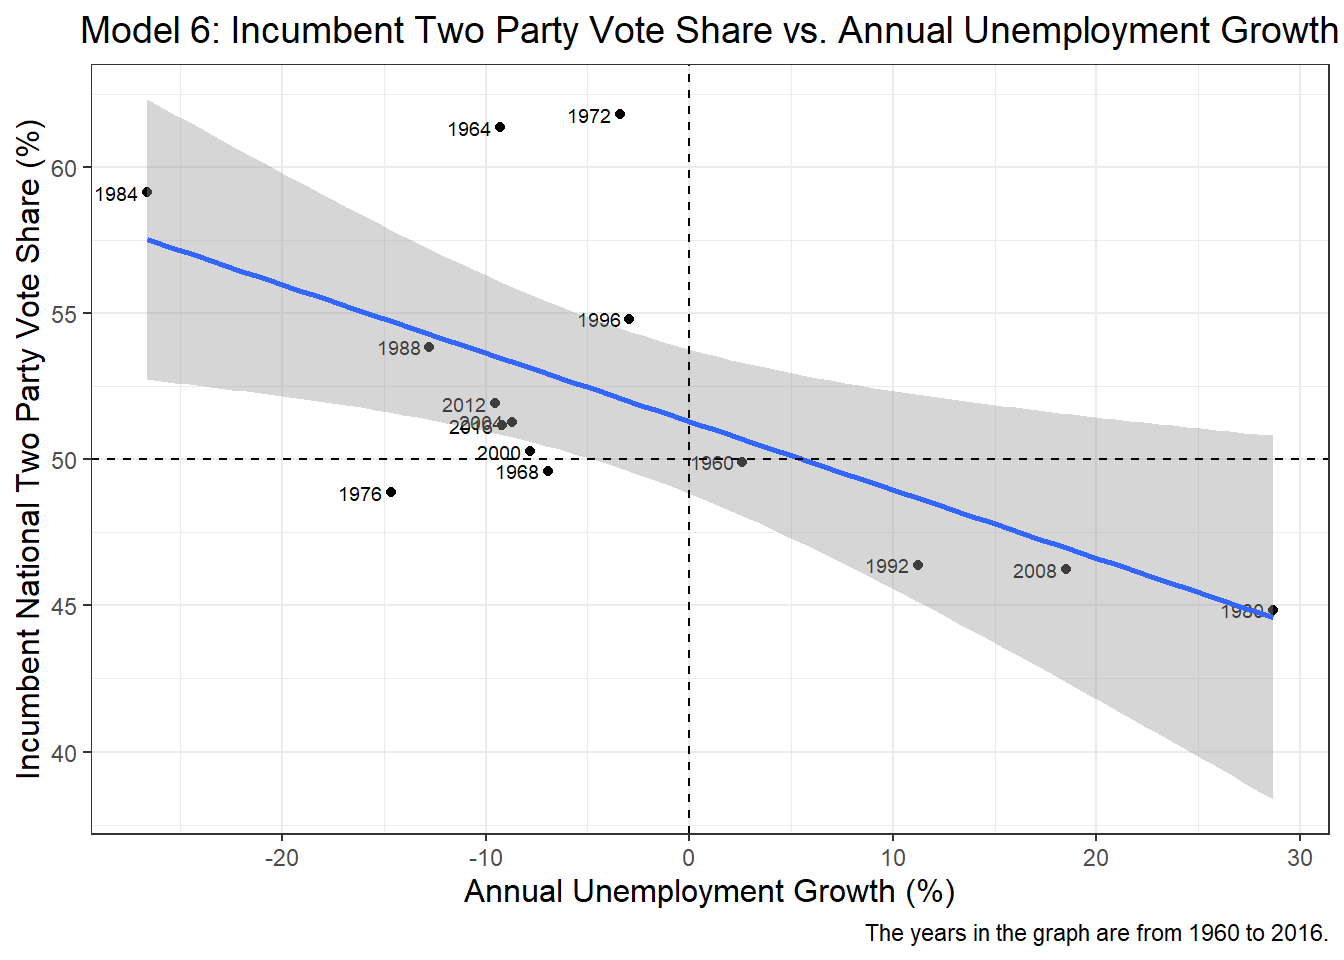
Both graphs show a strong inverse relationship between unemployment growth and two-party vote share. Looking at the tables, we see that a one percent reduction in unemployment is associated with a 0.6 increase in two-party vote share for the incumbent party. The annual model displayed a smaller coefficient of -0.23. Both models were statistically significant at the 0.05 level according to their p-values, and they had fairly strong R-squared values: 0.405 for the quarterly model and 0.38 for the annual model. Quarterly unemployment growth had the highest R-squared value of all six models analyzed.
| Incumbent National Popular Two Party Vote Share (%) | ||||
|---|---|---|---|---|
| Predictors | Estimates | std. Error | CI | p |
| (Intercept) | 52.13 | 1.08 | 49.78 – 54.47 | <0.001 |
| Quarterly Unemployment Growth (%) | -0.60 | 0.20 | -1.03 – -0.16 | 0.011 |
| Observations | 15 | |||
| R2 / R2 adjusted | 0.405 / 0.359 | |||
| Incumbent National Popular Two Party Vote Share (%) | ||||
|---|---|---|---|---|
| Predictors | Estimates | std. Error | CI | p |
| (Intercept) | 51.29 | 1.14 | 48.83 – 53.76 | <0.001 |
| Annual Unemployment Growth (%) | -0.23 | 0.08 | -0.41 – -0.05 | 0.014 |
| Observations | 15 | |||
| R2 / R2 adjusted | 0.380 / 0.332 | |||
Predictions and Concluding Thoughts
Given its poor in-sample model fit, I decided not to use the S&P 500 as a predictor for the election. All the economic predictors suggest a Donald Trump popular vote victory, but at a 95% confidence interval, an extremely wide range of outcomes is possible.
Table: Table 1: Predicted 2024 Incumbent National Popular Two Party Vote Share based on RDPI Growth
| Independent Variable | Predicted Two Party Vote Share | Lower Bound (95% CI) | Upper Bound (95% CI) |
|---|---|---|---|
| Quarterly RDPI Growth | 49.91 | 38.90 | 60.91 |
| Annual RDPI Growth | 47.88 | 37.73 | 58.03 |
Table: Table 2: Predicted 2024 Incumbent National Popular Two Party Vote Share based on Unemployment Growth
| Independent Variable | Predicted Two Party Vote Share | Lower Bound (95% CI) | Upper Bound (95% CI) |
|---|---|---|---|
| Quarterly Unemployment Growth | 48.97 | 39.33 | 58.61 |
| Annual Unemployment Growth | 48.45 | 38.49 | 58.42 |
Overall, I believe the best approach to using economic predictors is to aggregate multiple variables, such as RDPI growth and unemployment growth, and weigh them accordingly as part of a larger model that also incorporates polling and other fundamentals. It’s clear that no single economic factor is sufficient to predict an election, nor is there a strong preference between factors that affect personal wealth versus macroeconomic conditions. The highest R-squared any of the models achieved as 0.4, meaning around 60% of the variance in elections could not be accounted for. Of course, multicollinearity would be a significant issue in any model using multiple economic factors, so adjustments to account for it would be necessary.